
How to navigate the Timeline Screen
To get started, open the NOWATCH app and tap Timeline (the second tab at the bottom of the screen).
Explore Key Metrics
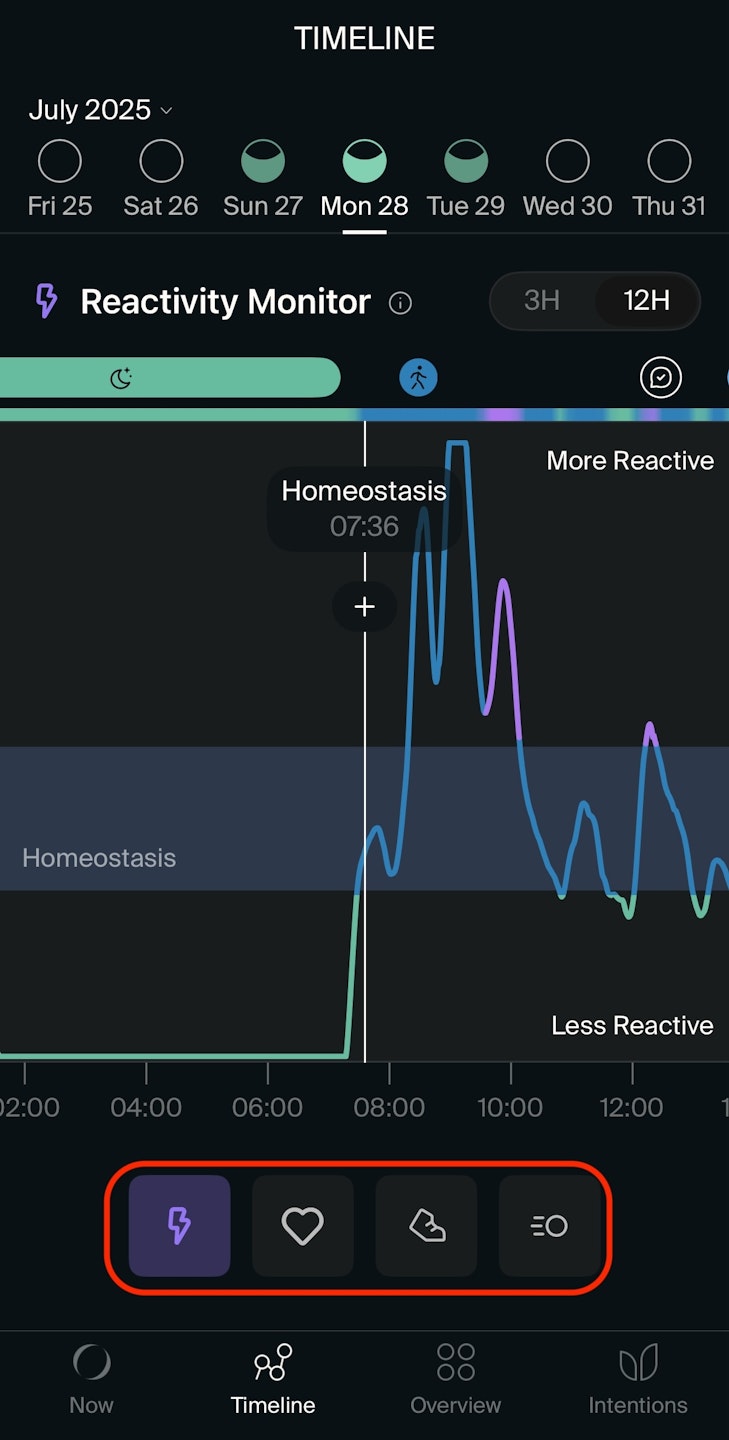
Reactivity Monitor (lighting icon): Tap to view your Reactivity Monitor graph, showing your reactivity scale (balanced, physically active, physically recovering, stress responses, less reactive, more reactive) across different times and days.
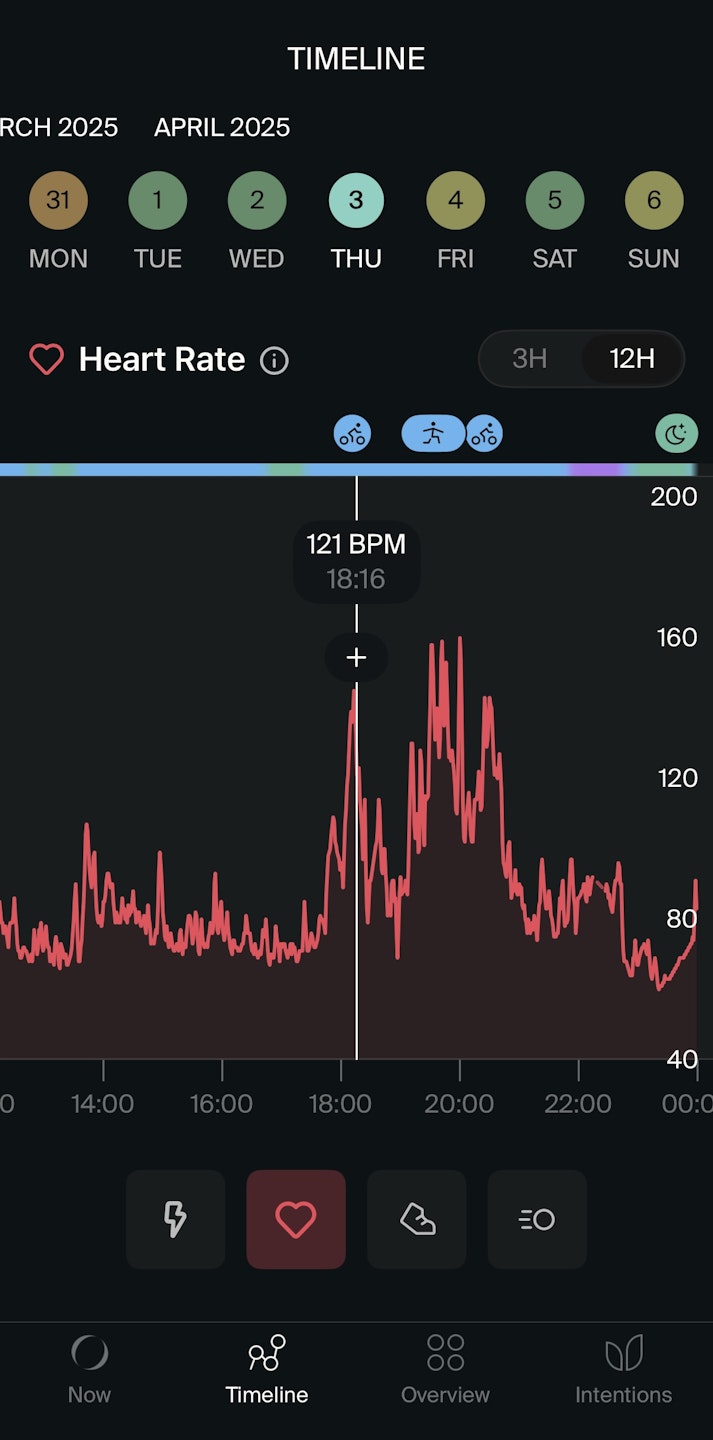
Heart Rate (heart icon): Tap to view your Heart Rate graph, tracking beats per minute throughout the day and over time.
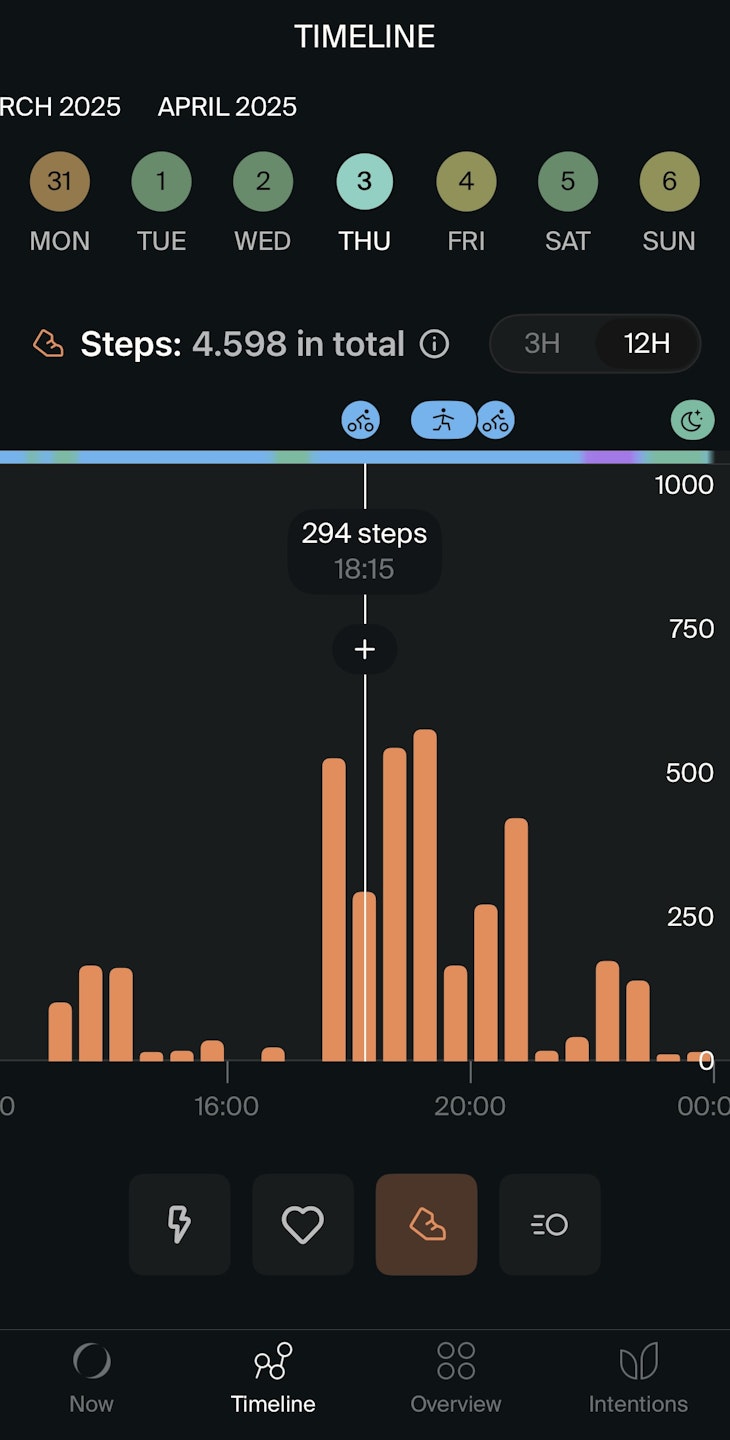
Steps (shoe icon): Tap to view your Steps graph, displaying your total steps per half-hour period and your daily step count.
Motion (circle icon): Tap to view your motion stages (vigorous, moderate, mild, light, and rest) throughout each hour and day (iOS only).


